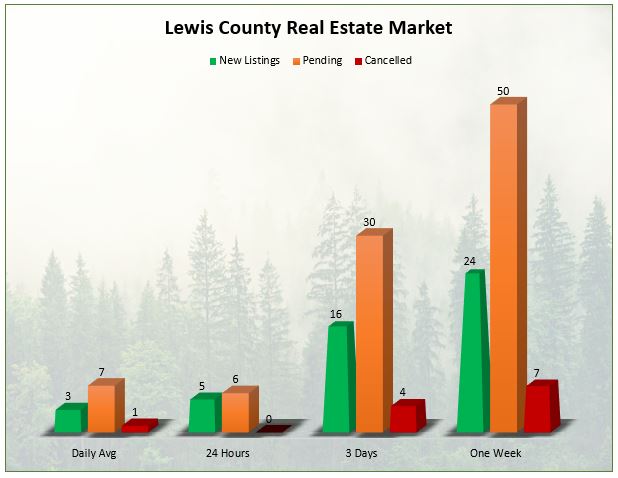
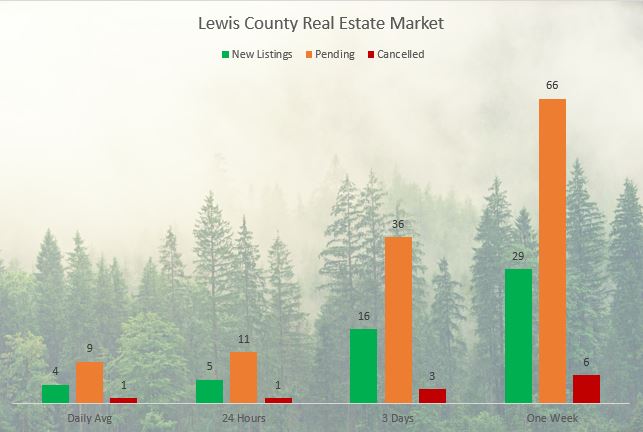
Last week, we showed a graph of new listings, pendings, and cancelled listings in Lewis County over a period of one week, 3 days, 24 hours, and a daily average. To give some context to these numbers, I thought it would make sense to do it again.
This graph is from last week.

This graph is from this week.

As you can see, the listings and pendings are GOING UP and the cancellations at worst are staying the same even though we saw a decrease of one.
Our feelings are fueled by our experience which is telling us the market can’t continue. The REALITY is that the market is healthy and vibrant in Lewis County.
If you’re searching for an agent who uses data to get your home sold for top dollar and in the shortest amount of time, I just happen to know a guy! 😉


