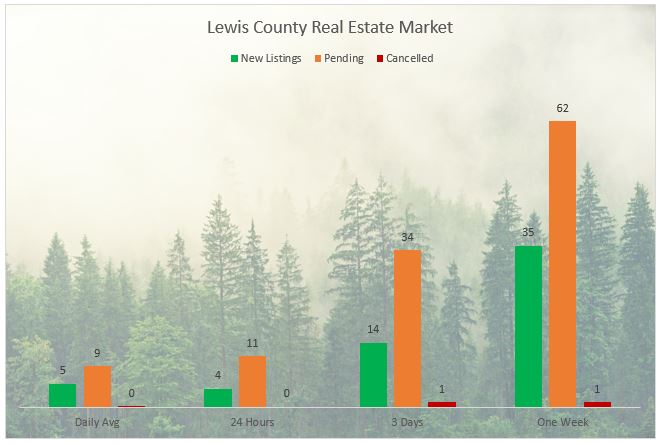
Here is the latest chart accurate as of 05.08.2020. We are averaging 5 new listings per day and 9 go pending each day. The number of cancellations have dropped from one per day to one per week.
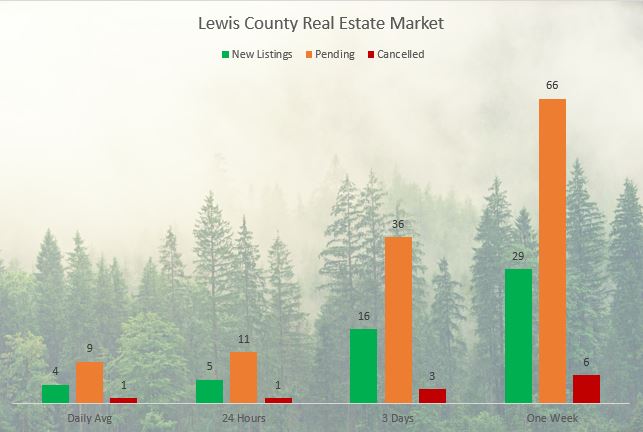
To give you an idea of context, here is last week’s chart:
Week to week, pendings are down slightly but new listings have increased.
What does this mean? It means, the market has remained relatively the same from before the lockdown and through it. I do foresee a ton of new listings coming to the market and as you can see, buyer activity is still there.
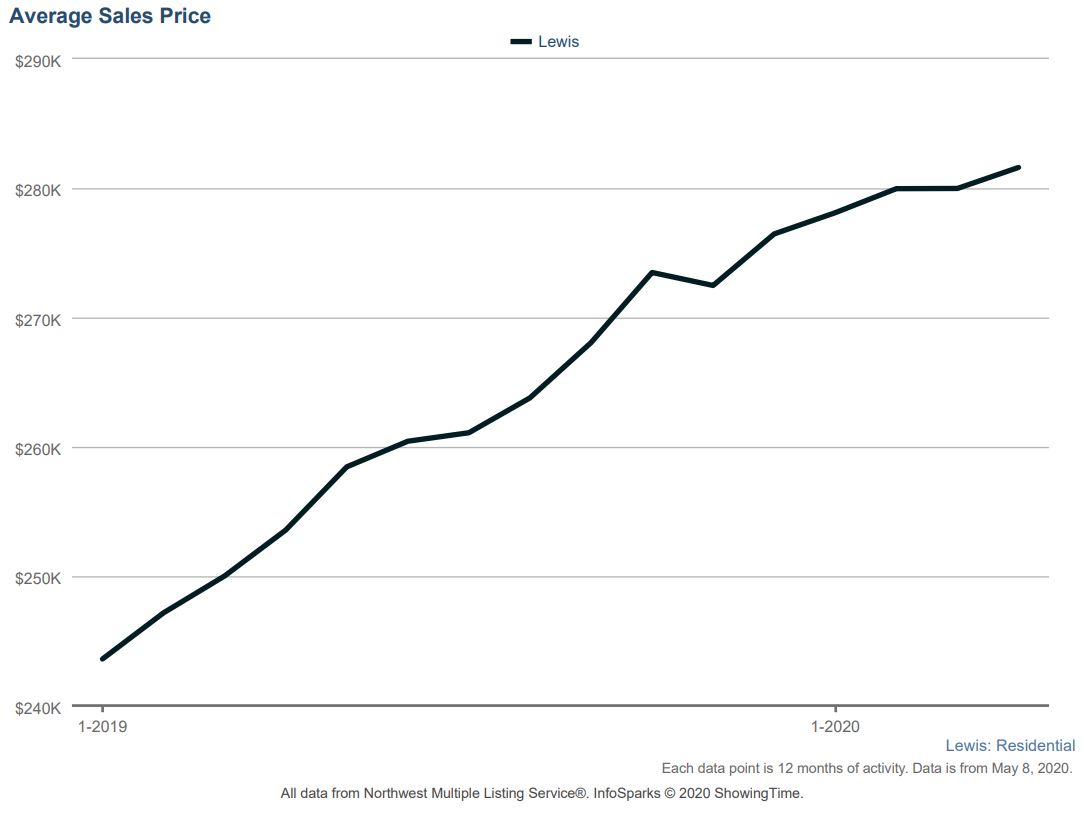
Would you believe the average price went up or down during this time?

The difference between the average sales price in March and April actually went UP about $1,700. That is quite a jump as we were starting to see a leveling of prices, but consumer confidence and the desire to own a home is continuing to push prices upward.
If you’re looking for an expert in the trenches to assist you with your home sale, I know a guy!


